On the surface, leveraged and inverse ETFs seem straight forward. But, they can be like one of those math brain-teasers that stump even the brightest people.
Leveraged ETFs
Leveraged ETFs are funds designed to seek a daily investment result that is a multiple of a benchmark index. For example, a triple leveraged ETF would yield about 300% of the gain (or -300% loss on the loss) of the benchmark index for that day.
Inverse ETFs
Inverse ETFs are funds that seek a daily investment result, opposite of a benchmark index. For example, an inverse ETF would yield a gain of the same percentage that a benchmark index would lose on a given day.
Leveraged Inverse ETFs
Leveraged Inverse ETFs are designed to seek a daily investment result that is a multiple opposite of the direction of the benchmark index. For example, a triple leveraged inverse ETF would yield a gain of about 300% gain on the loss (or -300% loss on the gain) of the benchmark index.
A lot of people think if there is a triple ETF (leveraged etf) on an index and that index goes up by X%, the triple ETF will also rise by three times X%. Additionally, one might think that if the index goes from $100 to $110, a $100 investment in a triple ETF should go from $100 to $130.
It seems simple enough, but that’s not how it works. A simple math equation helps us understand why leveraged ETFs don’t always give us that sort of performance.
Lets look at the math of these three ETFs
Triple leveraged ETFs attempt to match three times the daily performance. “Daily” is the operative word. The assumption of the stock going from $100 to $110 and the triple leveraged ETF going from $100 to $130 works only for one day. Over the course of several days this theory falls apart.
I’ll demonstrate this with a simple example. Imagine a stock (XYZ) that’s trading at $100. The first day, the stock drops to $95, a -5% drop. Let’s consider the triple ETF (+3XYZ) which is also trading at $100. The corresponding triple ETF (+3XYZ) drops to: $100 + 3 ($100 x -5%) = $85. The corresponding triple inverse ETF -3XYZ goes to: $100 – 3 ($100 x -5%) = $115
Simple enough.
Now, let’s assume the next day XYZ goes up to $105. That is a 10.53% increase. So, +3XYZ is going to increase by 3 times 10.53%. That is $85 + 3 ($85 x 10.53%) = $111.84
The next day, X drops back down to $95, a -9.52% decrease. Thus, +3XYZ goes from to: $111.84 + 3 ($111.84 x -9.52%) = $79.89.
You might expect that the +3XYZ stock would go back to $85. But, it doesn’t.
Here’s a table of how the XYZ stock and the +3XYZ and -3XYZ will respond over several days of XYZ oscillating up and down by $10.
| XYZ Stock | %Change | +3X | -3X |
| $ 100.00 | $ 100.00 | $ 100.00 | |
| $ 95.00 | -5.00% | $ 85.00 | $ 115.00 |
| $ 105.00 | 10.53% | $ 111.84 | $ 78.68 |
| $ 95.00 | -9.52% | $ 79.89 | $ 101.17 |
| $ 105.00 | 10.53% | $ 105.11 | $ 69.22 |
| $ 95.00 | -9.52% | $ 75.08 | $ 89.00 |
| $ 105.00 | 10.53% | $ 98.79 | $ 60.89 |
| $ 95.00 | -9.52% | $ 70.57 | $ 78.29 |
| $ 105.00 | 10.53% | $ 92.85 | $ 53.57 |
| $ 95.00 | -9.52% | $ 66.32 | $ 68.87 |
| $ 105.00 | 10.53% | $ 87.26 | $ 47.12 |
| $ 95.00 | -9.52% | $ 62.33 | $ 60.59 |
| $ 105.00 | 10.53% | $ 82.02 | $ 41.45 |
| $ 95.00 | -9.52% | $ 58.58 | $ 53.30 |
| $ 105.00 | 10.53% | $ 77.08 | $ 36.47 |
| $ 95.00 | -9.52% | $ 55.06 | $ 46.89 |
| $ 105.00 | 10.53% | $ 72.45 | $ 32.08 |
| $ 95.00 | -9.52% | $ 51.75 | $ 41.25 |
| $ 105.00 | 10.53% | $ 68.09 | $ 28.22 |
| $ 95.00 | -9.52% | $ 48.63 | $ 36.28 |
| $ 105.00 | 10.53% | $ 63.99 | $ 24.83 |
| $ 95.00 | -9.52% | $ 45.71 | $ 31.92 |
| $ 105.00 | 10.53% | $ 60.14 | $ 21.84 |
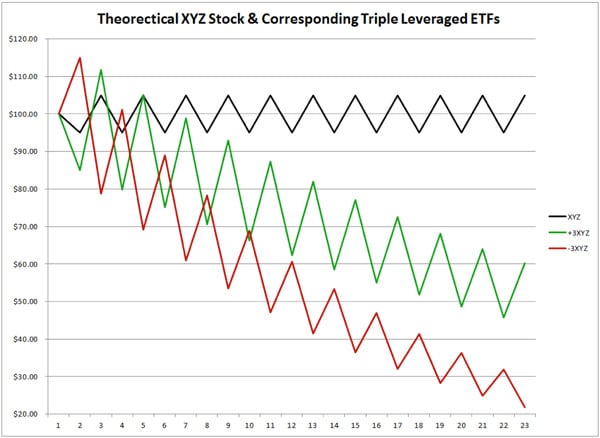
That’s probably not what you would expect. Here’s the chart:
(This shows the stock falling, but it could also rise more if there were a few up day in the beginning.)
For this reason, the leveraged and inverse ETFs are only designed for intraday trading. They are not intended to be held for longer than a day. If you read the prospectus, this is clearly stated. (Who reads the prospectus?!) Regulators are taking a closer look at these types of ETFs because people are blowing-up their accounts.
The Russell 1000 – leveraged, and inverse leveraged ETFs
There is another factor that often escapes investors. Leveraged ETFs are periodically rebalanced. Here’s a recent example considering two popular leveraged ETFs. The FAS, which is the 3x ETF of the Russell 1000 Financial Index (RUI), and the FAZ , which is the -3x ETF. Here are the quotes for a couple days in October 2011.
|
10/6/2011 |
10/7/2011 |
% Change |
|
| RUI |
642.45 |
636.65 |
-0.90% |
| FAS |
57.55 |
52.05 |
-9.56% |
| FAZ |
58.35 |
63.81 |
9.36% |
You can see that the RUI changed by -0.90% overnight. You would expect the FAS to change by three times that or be a -2.7% change. Yet it changed by -9.56%. That is a huge discrepancy from the 3x it is was supposed to move. Instead it moved by more than 10x. Coincidentally, the FAZ moved by approximately the same percentage. If you held the FAS overnight, you would have found your investment down by much more than you would have expected. This kind of move happens to investors quite often.
What caused that to happen? Because these ETFs are comprised of complex derivatives (e.g., swaps), they don’t always perform exactly as expected. To account for that the fund managers did some sort of rebalancing, overnight. It’s a risk that’s stated in the prospectus. (I really think you should read the prospectus!)
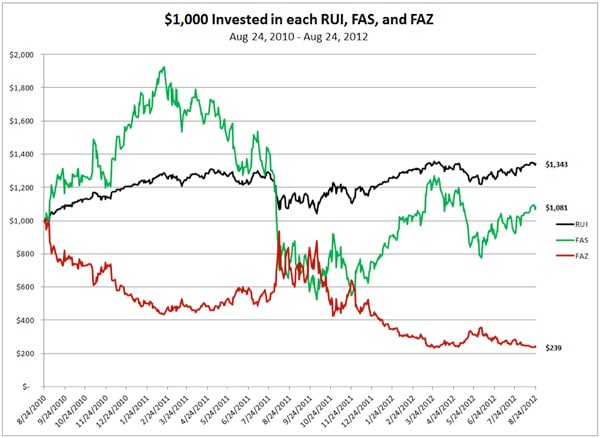
What does this look like in real life? Let’s consider investing $1,000 in each RUI, FAS, and FAZ. You would expect that the moves in the FAS and the FAZ would cancel each other out. That is true in the short-term. But in the long-term – because of “the math” and the re-balancing – it falls apart.
Here’s a chart of those investments.
You see that after two years, the FAS and FAZ are now worth $1,320, combined – a net loss of $680. There were times when the value of both investments was more than $2,000.
So here’s what I think
You might say: a wise investor would have taken profit, earlier.
I would say: a wise investor wouldn’t have placed the trade in the first place.
Even if you were bullish on the RUI, and only bought the FAS, you didn’t do as well as expected. The $1,000 RUI investment would have risen to $1.343. The $1,000 in the FAS only rose to $1,081. That is hardly 3X performance.
Leveraged ETFs are not intended to be held for anything longer than a day. Doing so can result in significant losses, that can come without notice.
If you still doubt me on this, pick up the phone and call the toll free number for companies managing these funds. (Proshares: 866-776-5125 Direxon 800-851-0511 iShares 800-474-2737.)
Surely, there are people making money holding these ETfs longer than a day. But, guess what? Some people win money at the casino, too – most people don’t. My suggestion is that you leave them for the purpose they were designed for – intraday trading. There may be some options strategies that could work for more than a day. But, they are unconventional and probably not appropriate for your average options trader.
Eric Hale
OptionsANIMAL Instructor
Options Trading Resources
option trading education * options trading example * options trading 101 * options trading program * beginner investor * options trading system * options trading education * options trading classes


