 Moving Average Crossovers are trending indicators, while oscillators, in general, are momentum indicators. The MACD, a favorite here at OptionsAnimal, is a combination of some of the oscillator principles with those of a moving-average-crossover, a trending indicator.
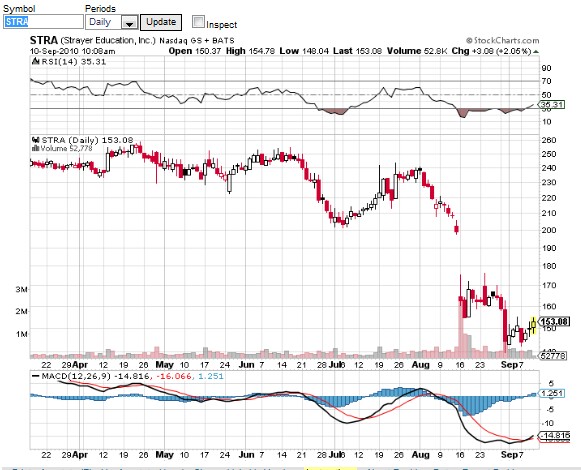
The MACD was developed by Gerald Appel and is one of the more useful technical indicators for Chartists. The faster moving line (called the MACD line) is the difference between two exponentially smoothed moving averages of closing prices. The slower line (called the Signal line) is a look back period exponentially smoothed average of the MACD line. The default setting is a 12 and 26 period moving average, smoothed by a 9 period exponential average of the resulting difference of the two moving averages.
The buy and sell signals are given when the two lines (the MACD line and the Signal line) cross. When the faster MACD line crosses above the slower Signal line, it triggers a buy signal. When the faster MACD line crosses below the slower Signal line, it triggers a sell signal. It is in this sense that the indicator resembles a dual moving average “trending” crossover method.
The MACD values also fluctuate above and below a zero line. That’s where it begins to resemble an oscillator. A overbought condition is present when the two lines are above the zero line. And, an oversold condition is present when the lines are below the zero line. The best buy signals are when the two lines are far below the zero line. The crossing of the zero can also be viewed as a buy or sell signal.
As with all oscillators, one of the most useful signals occurs when there is a divergence between the trend of the MACD lines and the price lines. A negative, or bearish, divergence exists when the MACD lines are well above the zero and begin to weaken while price continues to trend higher. That is often a warning of potential topping action.
One other feature of the MACD is its histogram, those solid bars arising from or descending from the zero line. When the MACD lines are in positive alignment (faster line over the slower), the histogram is above its zero line. The real value of the histogram is spotting a narrowing or widening of the two lines. When the histogram is over the zero line but starts to fall toward the zero line, the uptrend is weakening. These histogram turns give early warnings that the current trend is losing momentum.
A successful trader looks for confirmation from several technical indicators before enter or exiting a trade.
Emilu Bailes
OptionsANIMAL Instructor
Options Trading Resources
learn to trade options * options trading course * options trading classes * options trading education * beginner stock market investing * options trading 101
