We provide some outside-the-box classes at OptionsANIMAL for members who have come to learn about options behavior, so that they can make a nice profit in their accounts. These classes are in the educational level 8 (top of the curricula) and are labeled “Vegas Trades.” Although we spend some time in the basic education classes showing the importance of implied volatility (IV), we don’t get specific about what can happen to the value of the trade as the IV changes.
Let’s start with what causes IV to change. Many equities experience a rise in IV as they approach their earnings-per-share (EPS) report. Once the EPS has occurred, the IV drops back within a normal range. [IV only has an impact on the portion of the option value that is out-of-the-money (OTM): extrinsic value.]
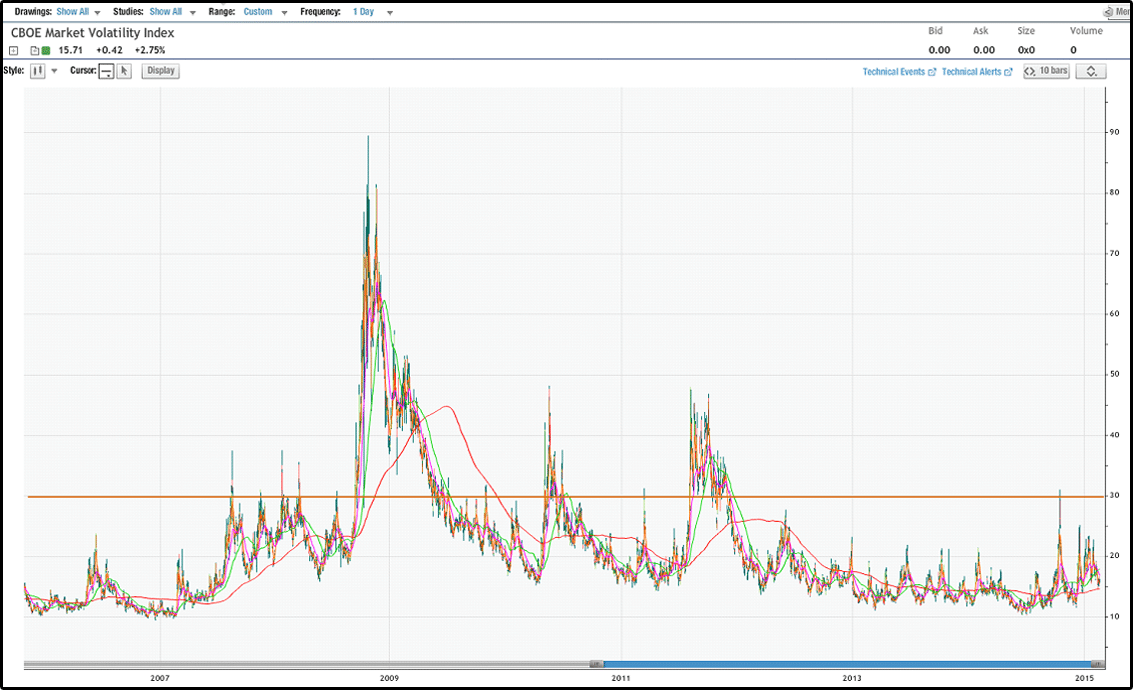
The Chicago Board of Options Exchange (CBOE) Volatility Index (VIX) is a key measure of market expectations of near-term volatility, conveyed by S&P 500 stock index option prices. Since its introduction in 1993, VIX has been considered by many to be the world’s premier barometer of investor sentiment and market volatility. Several investors expressed interest in trading instruments related to the market’s expectation of future volatility and so VIX futures were introduced in 2004. VIX options were introduced in 2006. It is also known as the “fear index” to investors. If we view the daily price chart of the VIX over the past 10 years, we will see few times when the index is above the 30 level. Here is the price chart of the VIX for that period of time. [View the numbers on the vertical axis on the right. I’ve drawn a line at the 30 mark.]
The day during the past year where the VIX popped over the 30 mark is October 15, 2014. At one point on that day, the VIX was at $31.06. That same day, I entered a Vegas Trade on Tesla (TSLA) where I selected a long term OTM Bull Call Spread. The spread of 255/260 January 2016 cost me $1.50 per share ($150.00 per contract). The IV of the spread was 67.04%, and the price of TSLA upon entry was $218.14. When was the EPS on TSLA after that trade entry? November 5, 2014. Take a look at this 6-month daily chart on TSLA:
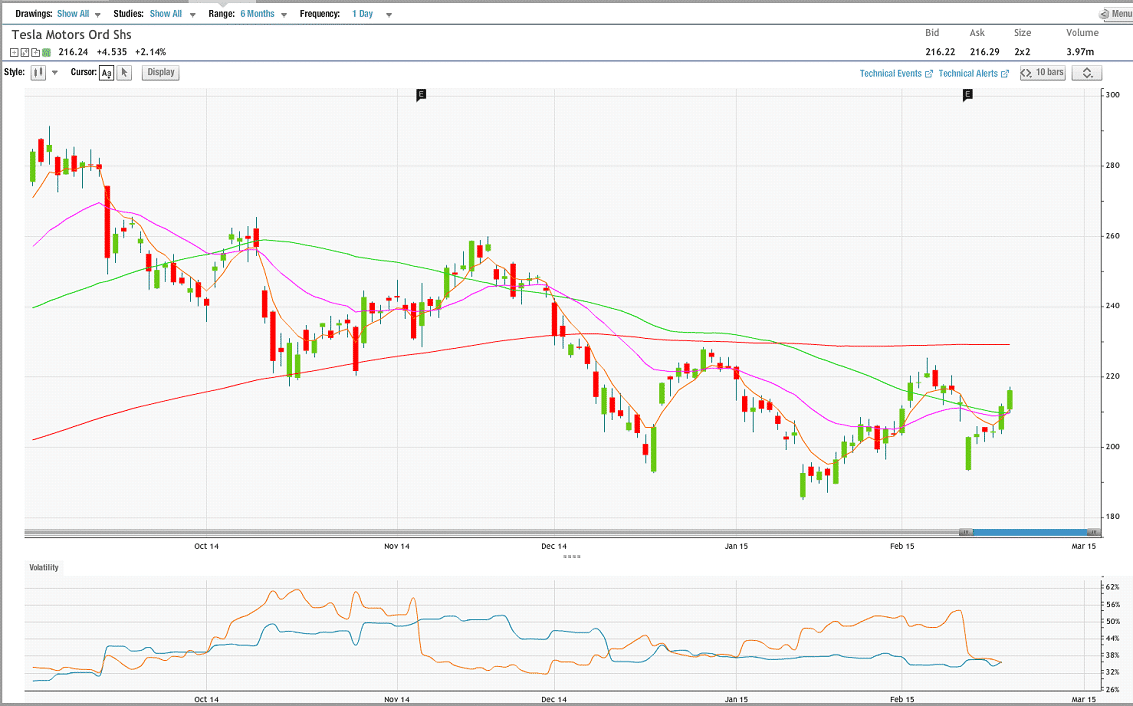
The individual bar graph is the price bars on a daily basis for the past six months. The lower oscillator is the view of the volatility on TSLA: Blue Line = Historical Volatility, Gold Line = Implied Volatility. The red line on the daily bar chart is the 200 simple moving average (SMA), and the point where the VIX was higher than 30 was on October 15th, the position of the red price bar penetrating the 200 SMA. That is the day that I entered the Vegas Trade (long term, OTM, Bull Call Spread that will expire the third Friday in January, 2016). What has happened to my open trade on TSLA during the past several months? Do you see where the price rose up from the 200 SMA? As that happened, bringing the equity price much closer to the strike prices, the value of the Bull Call Spread surged over $2.00 per share. If you block out the price bars where TSLA fell below the 200 SMA, you may wonder why I didn’t capture my reward quickly on this Bull Call Spread? I’ve been holding this spread trade open in my account for over four months. Are any of you wondering what the value of the trade is now? How about the IV level on this spread?
Most options traders know that options change their value as time passes. Those that are debit trades, such as a bull call spread, lose value due to each day that goes by.
At the end of last week, TSLA closed near the price that it registered upon entry: $217.11 v. $218.14. The Bull Call Spread held a value of $1.40 (slightly less than when the position was opened four months ago). Yet the implied volatility was at 38.52% v. the 67.04% it logged upon entry. That is 28.52% lower than it was when the position was entered! Where would I see that impact the options spread value? Vega. When we view that much decline in the volatility level, without much change in the fair market value, we would not see an achievement of the reward target.
At the entry of this trade, there were 456 days until expiration. Now, there are 329. The stock market has improved and is in a bona fide Uptrend; therefore there is higher probability of achieving the reward I’m seeking. I have just completed an important activity of “sharpening-the-saw,” evaluating the trade and confirming to myself that options are worth my attention!
Emilu Bailes
OptionsANIMAL Instructor