Some classes are very technical, I can repeat them as needed. I would rather retake a class than see it dumbed down.
This course is the most in depth study of options that I have experienced. Having over 30 years experience trading in the stock market and an MBA, I thought I had knowledge. I did but it was only superficial. Well worth the money.
I've done a lot of stock and option training education over the years but this is the first place that actually delivered on what they advertise. They don't just give you trades or give canned formulas to execute, they give actual training courses and make sure you understand them before moving on to more advanced topics. There is ample opportunity to get feedback from instructors on any and all aspects of option trading. I had been trading for years before signing up and I didn't know how much I didn't know. I am so much more successful in my trading than before and I'm learning more here everyday. Worth the price of admission!
The lessons are excellent, organized and easy to follow . Can take you from beginning student all the way through "PHD" level options trading. Several instructors to choose from (all good) and each has his/her own style to make learning FUN. The best part is : you become a profitable trader.
Great company, Great investors, it's only when a company serves her investors with truthfulness and reliability that it may produce great investors.
This awesome company has been making thousands of people millionaires every year according to the company's info.
At first I doubted, but at a point I decided to give them a trial and here I am now sharing my testimony.
You too can benefit from this same company from anywhere around the world, you only have to contact one of the company manager person like Mrs Patricia Brayan to help you grow your investment capital within a week, contact her via whatsapp number:+1(608)6186312 or email: [email protected] My wife and I have tried other on line trading academies and were not impressed with them at all. We became very frustrated to the point of almost giving up the idea of ever being able to learn how to trade options. We heard about Option Animal and decided to give it one more try and we are glad that we did. We were immediately impressed with the entire program. The lessons, both live and archived, are easy to follow and very well done making it simple for even the most novice trader to understand. The instructors are extremely knowledgeable and offer personalized attention when needed. We highly recommend Option Animal if you are serious about learning how to trade options.
I was with Options Animal for 18 months and learned so much useful information that I needed in order to trade options successfully. I am very satisfied with my experience working with them. There is an abundance of resources on their website and I was able to post questions to the coaches and other participants with responses that were quick and answered all my questions. It took a lot of hard work on my part to learn this but their education was top notch. They are a very professional company and I wish I could stay on with them but at the same time, I feel I’ve learned enough to move forward on my own. I highly recommend Options ns Animal to anyone who is truly wanting to learn to trade options
Options Animal is best place to learn options. There is no other place even close. The instructors are available are very knowledgeable and will do everything to make sure you learn. Also it is like community and you can learn a lot by reading posts and questions from everyone. You can also follow instructors trades in paper trading account to learn and adjust. Instructors like Eric, Charan, Horace, Joe, Karen and Jeff and wounderful folks like us- They are always available to help me. I feel lucky that I found them.
Hands down the best financial education program I've seen. Game changing in terms of my knowledge and performance!
I don't usually pay for stuff like this because I feel all the info I need is free on YouTube. I stand corrected. Their training program is excellent and they have fantastic customer service. I have learned so much since I started using their curriculum.
I learned to trade options and make adjustments to trades moving against my expectations. I very seldom have a loosinng trade now and never for much money. Covered call strategies are truely wealth building.
Options Animal has been great to work with. There are many trainers to work with who have different styles of teaching and trading. I have found several that I like and learn from. The training they gave me has benefitted me so much that the gains I have made in my trading account has more than paid for my subscription to the lessons. Love this company and their trainers!
Brice is very easy to work with and does what he says he will do. Thanks again Brice for the good service
If you are serious about learning options, this is the place to be. I got interested in option in late 1990's. I saw that you could leverage a small amount of money to make big money. Went in with a mind set of "get rich quick" attitude, that was a mistake. Did not touch options again until more recently. Thank goodness I found OptionANIMAL. I was skeptical but felt like I needed to learn more before giving it a try again. Glad I did because I learned a lot and continue to do so. To be successful you must put in the work and have a plan. OpttionANIMAL was the help I needed with material and teachers who were eager to share their knowledge. Here I was able to learn from the courses how to avoid all the most common mistakes, how to allocate your portfolio when making a trade, how to adjust a trade and much more.I can’t say enough about the teachers and how willing they are to help you learn and set you straight. They are all different and have different perspectives of how to handle and analyze the market. Each one brings different knowledge and experience. If you are willing to put in the time and effort you can up your game. There are no guarantees, but you want to make sure you hedge your knowledge to be on the right side of the trade.
I decided to become a lifetime member of Options Animal. The courses they have are very detailed and really answer the questions I have. If you find that you still have questions, you can reach out to the instructors for additional clarification. Also the courses are updated all the time so they discuss what the current state of options are, which is great! Im excited to continue my Options journey with Options Animal!
By far the best educational source for options trading that I have found in my 4+ years of learning. An incredible amount of information, education, and support - worth every investment penny for anyone serious about learning options trading. The most helpful, passionate, and skilled instructors - all with different perspectives that make it easy to find your own path instead of getting told what your path should be.
If you a new or an experienced options trader this is very much desired service where you can learn a lot and get help when you need it most from live coaches at Options Animal.Keep up guys with great work!S. G.
I've been a member of OptionsAnimal for approximately 5 years and have completed all 8 educational levels. They are terrific! I get dozens of emails daily with various other groups promoting their products to "hit it rich" with stocks and options trading, but I find that most of them are promoting their products to enrich themselves. But with OptionsAnimal, each instructor and the staff really care about providing a top-notch education and quality advice. After 5 years, I realize the more I know the more I realize how much I don't know! So, having access to the OptionsAnimal educational materials whenever needed is really helpful. I wholeheartedly recommend OptionsAnimal!
They teach everything you need to know about trading stocks and options. And they don't just teach you what a strategy is, they teach how and when to use it, how to maximize your returns, and protect yourself against market shifts! I had never heard of "trade adjustments" before OA, and now some of my biggest profits have come from trades I would've previously closed for a loss!Other companies send out trade alerts based on "back-tested" algorithms (hypothetical trades). Whereas with OptionsANIMAL you see REAL trades their instructors place with their own money! There is nothing hypothetical about them! The instructors share their backup plans and the due diligence that lead them to place that trade. These have helped me to refine my own trading and how I structure positions in my accounts.I am so grateful that I found OptionsANIMAL. If you are serious about trading, you need to check these guys out. You'll be glad you did.
Guys.,, I´m enchant, the learning is being great, I personally have to tell you that the return on investment was in 4 weeks, I´m so happy I feel blessed that I found options animal. Eric, Karen Jim, Joe, Charan, all instructors are great and easy to work with it.thanks for changing my life as an investor, I had 22 years as an investor and this by far has been the best of best learning experiences.RegardsKarim
I have been trading options for several years with some success just as a hobby, when I decided to trade options as a business and a source of a regular income, i searched for an educational platform to enhance my understanding and of the market dynamics when it comes to trading option I discovered Options Animals, called them, confirm that this was an educational focused platform that I could benefit from. The rest is history, I could not be happier with the results and support I received over time. They will teach you on how to enjoy the success rate of 90 plus percent of profitable trading with a thoughtful methodology and a plan of execution.
I am sold for life. Keep up the great work everyone.
Thank you,
Steven Hollosi
Trade with MRS Sherry Murphy and her company and have a wonderful trading experiences where your money is rest assured and your profit is very easy to withdraw.. I just made another withdrawal and I think it's worth testifying. Contact her
[email protected]
WhatsApp :+ 13153028128 I found this to be an outstanding program - in-depth knowledge you cannot find anywhere else and the staff is always very supportive. I give it an A++.
Very professional group. Brice Hogan provided excellent pre and post sales support. The instructors are diverse and provide different views on the same subjects which helps me to be thoughtful about the subjects and retain the information. The classes are well laid out and build upon themselves. The community approach provides me with an environment that will foster lifetime learning. This is not the first investment education company but their lifetime membership is an excellent value for my long-term growth. Thank you.
LOVE the course curriculum and instructors! I have been, and will continue, to direct people towards OA as the #1 place to learn both Options Training, as well as a deeper understanding of the important of knowing the market movements, impact of various meetings/announcements, and the value of deep fundamental research.Truly am much better for having spent the time with OA that I have and look forward to learning much more with them in the future as well!
I was very hesitant to join Options Animal, I guess I'm just a suspicious person. I just never know if I purchase something like this, will be worth the money. I have traded for over 40 years, so I didn't know if they were just going to teach me what I already know. In the end, I went for it, and I'm so happy that I did. I just finished the course and it was more informative that I could have ever dreamed of. They also give you weekly trades and they are incredibly consistent with winning trades. I couldn't be more happy with the classes and the weekly trades. Most of the classes that I took were taught by a woman named Karen. She is one of the best teachers I have ever had and I graduated from UCLA. Her knowledge of trading options is top notch and the way she conveys that knowledge is very easy to understand.Options Animal was the best investment I have ever made!
Very straight forward solid education. No get rich quick B.S. Learn, follow, prosper!
Options Animal is one of the best, if not the best, educational experience I have ever had. If there were more than 5 stars I would rate them a 10.
Very Educational, I have been trading options for some time and I have recently purchased their classes and I have learned a considerable amount in the little time I have been attending. So far I am very pleased I joined this community.
After many years of trying, I now have confidence I can make great passive income through trading. Without OptionsANIMAL, I doubt I would have ever got there. The instructors and courses are great! I have not had a losing trade since joining. What has being key for me are the exit strategies, when Plan A has failed, you have a Plan B, Plan C.... This is key to becoming a success. In addition, I have found the weekly review a great watch. A good pulse check for how my own trading is going!
Options Animal is the place to learn about trading options if you are serious. There are 6 full time instructors that teach daily to fit anyones schedule including night and weekends. All the classes are recorded so you can study 24/7. All the instructors share common goals but have very subtle differences in their approach. They teach how to make money in all situations when the market is down as well as stagnant or up. They have approaches for very short term trades as well as crock pot trades that can be left alone for 6 months to a year. Their emphasis is understanding the theory and application so you can use the knowledge to develop your own trading style and not be dependent on them. Can't recommend the team highly enough.
As a 23 year old with a decent amount of trading experience, I decided to try options. It always seemed “scary” which led to me trading other things like crypto and stocks. I always thought options were interesting but they seemed more complicated. With “theta” and “delta” and strike price and all these other things that made it seem super hard to understand. I finally decided I wanted to try them and started watching some YouTube videos but it still wasn’t really making sense and was hard for me to wrap my head around. That’s when I was introduced to OptionsAnimal by a friend. OptionsAnimal is a great options education for all skill levels in trading, from beginners who have never traded before, to more advanced traders looking to hone their skills and engage in a community of real, honest traders, not “gurus” trying to sell stock picks or other services. The education breaks trading down to a fundamental level that focuses on learning how markets and trading work, as opposed to just putting out stock picks or a single trading strategy that doesn’t always work. Instead they focus on building an understanding of why and how and provide a framework for building your own strategies based on solid trading theory. They also simplified the daunting jargon of options and made the Greeks, and other seemingly complicated aspects of options easy to understand and utilize in trading. The biggest benefit of OptionsAnimal beyond the education, however, and the thing that I think separates them the most from any competitors is the community. There are always live classes being held either covering education material, or live Q and A sessions with instructors, or weekly market updates on how the markets are acting, upcoming potential catalysts, etc. In addition, there are forums in the website where all of the instructors are available to communicate with and ask questions to, as well as the entire community in general. Overall it is a far superior experience to other competitors I have tried. I would recommend to anyone looking to get into options or looking to advance their skills and understanding.
OptionsANIMAL is not the first trading education I've paid for, but it is BY FAR THE BEST! I've been studying with OA for about 18 months and have not once been disappointed in the instruction or support services. OptionsANIMAL is pure class all the way through. The instructors earned their way into their positions, so they speak with real rather than theoretical knowledge. The lessons plans are clear and comprehensive, and the instructors are skilled communicators. They are also accessible as you can address questions to them and they actually respond.I have gained so much trading confidence through OptionsANIMAL that I see it as a vital part of my life. The emphasis on secondary and tertiary exits has allowed me to react confidently whichever direction the market turns.I could go on to the point where this review would lose credibility, so I'll stop by saying joining OptionsANIMAL is one of the best decisions of my life. It has blown the doors of possibility wide open for the future.
The best place to learn how to trade stocks and options.OptionsANIMAL teaches a unique, straightforward 6-step process. It's flexible. It allows you to develop an approach that is suitable for you. Works for large portfolios looking for protection and income. Works for smaller portfolios looking for leverage and growth. Their process steps through developing a trading plan that works in any situation - bullish, bearish, or stagnant. And, more importantly, the plan allows for adjusting when the trade goes against you. There is a vibrant community of like-minded people. The instructors and members are available to provide support and ideas everyday. Daily market updates. The instructors share real-money trades from their portfolios every week. Fair warning, there is a learning curve. Like anything good, it requires some time and effort on your part to to get through the curriculum. Live and recorded classes allow you to move at your own pace. The instructors and community members are there help you along the way. You should definitely check it out. There's a reason why thousands of people have been through this program: it works.
They offer a systematic approach to options education. Each instructor has taken the courses. They are all intelligent, articulate and available to answer questions. No sales gimmicks just a commitment to the students. I highly recommend them.
This company is for real! The education is top-notch and can help you whether a beginner or a seasoned veteran looking for new approaches. If you are looking for the resources you need to add options trading to your investing, I can't imagine a better place to get it. The community is amazing and supportive, the instructors are great, and the site has endless archives to go through. Following along with experienced traders as they identify, make, and then adjust trades really drives the lessons home. I wish I had joined this 10 years ago.
A well structured curriculum to master the intricacies of options trading. Archived sessions allow you to go at your own pace and review areas of weakness. Live classes with instructors are interactive with a chance to ask questions. The teachers are great with helping to clarify issues and help you succeed. Following he Options Animal 6-step process will lead to trading success. The tuition is worthwhile compared to paying the school of hard knocks. I haven't mastered everything but am a much more confident and profitable trader.
This is the best place for options trading educations. I was the one jumped in slowly. Took a few of their free classes. I saw they gave good values. Then, joined their "beginner" classes and later upgraded to their full curriculum. And now, I am a lifetime member. The only regret was that I didn't join earlier and started trading options sooner. Take advantage of their free classes and see for yourselves.
Even though I have been trading options for a couple of years, I was happily surprised by learning things I either did not know or did not understand as well as I should have.Excellent education program that is good for everybody from beginners to experienced options traders. Plenty of resources and actual people who can answer your questions or help you deal with any unexpected difficulties.Top notch organization doing top notch work. Check them out.
Fantastic Training that you can do at your own pace.
I have been a member of Options Animal for slightly over a year. This is by far the best service I have ever used. My membership includes the education, weekly market reviews, Instructor Trades, and twice a month interactive session with one of the instructors. I find everything to be highly educational and helpful to help me become a successful Options trader. I love Options Animal and will become a lifetime member soon. I have had a great year.... Thank you Options Animal!!!
overall good training and covering all that is important in placing and managing options trades. Platform is very old and not user friendly. in todays age, I expected something much more advanced. Warren, my personal coach, is a great guy, and available always for any question I have.
It is legit with certified courses and tax incentives.
I had tried training with a couple of other courses, and was losing badly. Happened across Options Animal, and it was a whole new world. Here I found out that it's a lot more than just buying or selling puts and calls. Better details on choosing equities, strategies to minimize risk and maximize using the markets direction. Great training available with multiple instructors. If the first one doesn't match your personality great, there are 6 more. Worked for me. Can't say enough for the training! Glad to be an "Animal"!
Great education and support to learn to earn. I have done a lot of investing education and this is one of the few systems that gets a gold star.
I took the plunge with OptionsANIMAL because I was tired of "running in place" with my options trades. I'm just getting started with the Level 5 classes, and already my trading results have improved, substantially. The amount of training material that is available is incredible. If you take the time to actually study the material your trading will never be the same.
Webinars have great examples of a superb strategy trading options. First in money management and trade adjustments limiting losses. My choice for learning from the best.
This company is for real! The education is top-notch and can help you whether a beginner or a seasoned veteran looking for new approaches. If you are looking for the resources you need to add options trading to your investing, I can't imagine a better place to get it. The community is amazing and supportive, the instructors are great, and the site has endless archives to go through. Following along with experienced traders as they identify, make, and then adjust trades really drives the lessons home. I wish I had joined this 10 years ago.
I never believed it works this way, i was very doubtful about Bitcoin and all other online trading , I decided to risk $600 with Mrs Peggy Abbott fx, after I saw testimonies of people on how good she is but I was Very skeptical but she prove me wrong with my first trade and I'm so happy today, so I'm recommending her to everyone of you to invest with her and testify like me. Contact her now on
Email: [email protected]
WhatsApp +1(475) 295-1383.... This is the program that I wish I knew at the beginning before I poured in ridiculous amount of money in order to learn about options trading. Highly recommended.
How The Animals Play the GameOptions options endless bucksSounds so good but now I'm stuckTerms confusing, where to startThe OA coaches do it smartBuild your option with a planBalance risk reward and chanceThen like SEALS on secret missionsPlan your exits with precisionAnd if by chance you plan goes sourYou exits have a secret powerAdjust it for your profits claimThe only way to play the game- Bob the budding options guy
Money well spent. They give you all the education you need. The rest is up to you.
I have been with options animal for a couple of years now. I was previously trading options with varying degrees of success but with no real understanding of what I was doing and whether or not it made sense. Options animal has given me a grounding that I needed to begin to manage my portfolio and understand the trades that I'm placing. It's training has helped me replace "greed and gambling" with common sense It is giving me an understanding of the options market. All of their instructors are excellent and it is a great virtue that they have and explain different approaches to the same lessons. I always find that I learn best when I review the same materials from different competent sources. Option animal provides that in great measure. In my opinion it is well worth the investment and I continue to look forward to their programs and trading analysis.
Options Animal is a very honest company. They will work with you if you need help.
I am very impressed with the quality of education at OA. I am now confident that I can enter a trade with more than hope as a strategy.
A great investment for myself in options trading education. Very experienced and passionate educators. Acces to live and archived training material was key for me due to time diference. The curriculum is very well structured and this combined with weekly market updates helps you keep in tune with the market. Last but not least, a fantastic community to interact with through your training and trading journey.
Absolutely best school to learn options trading, OA has the best instructors and a fantastic curriculum for anyone who wants to learn and trade options, OA is by the the best online education for learning how to trade using options.
I've been an Options Animal member / student for a bit over a year now and am incredibly impressed with the organization, their depth of knowledge, their teaching methods and their support of their students. In fact, I just signed up for life time membership so that I can continue to make use of the resource for the rest of my trading career.Before becoming a student of O/A I had been studying options trading technique on my own, attending webinars buying books from Amazon & etc. for about three years and not doing very well at it. I was also trading equities as I had been for the past 17 years and my portfolios were increasing in value from my efforts but not by leaps and bounds. In fact I was just covering living expenses plus a little bit and looking for a way to become a more successful trader; hence my foray into options.Joining Options Animal was like stumbling out of the woods and into the sunshine. "Don't try to trade options until the end of the course when you will have learned how to do it." was their first piece of advice. ( Wish I'd had that tattooed on my wrist three years ago. It would have saved me a bundle.) Next piece of advice: "If you do experiment with trading options just count the results as increased tuition costs." (Yeah, I had to learn that the hard way.)Then they proceeded to a very detailed analysis of markets / equity trading with instructions on where to find the real information for fundamental analysis. This alone resulted in a measurable improvement in my efforts at equity trading. After that it was straight into options, "the Greeks" & etc.What makes the O/A teaching method a cut above anything else, in my opinion, is that there are four primary instructors all from different backgrounds who each teach all the lessons in the curriculum. All of their efforts are recorded in the O/A archives which gives the student the ability to gain exposure to the same material from four different perspectives. And because the instructors are continually presenting the material over time one can gain a better understanding from listening to the same person giving the same talk but in a slightly different way.Any points not clearly understood can be repeated instantly or reviewed in its entirety later. Students can also interact with the instructors in real time during the scheduled sessions or attend the weekly open forums to cover specifics and have additional questions answered. One is not locked into a rigid class schedule which is going to move forward whether the student understands the presented material or not.In addition there is a bulletin board / chat room organized by courses and lessons and related subjects where students and interact and learn techniques from each other and the participating instructors.Long story short: if you really want to improve your trading to the point where your success rate is above the ninety percentile point then Options Animal is what you've been looking for.
I have been pleasantly surprised with Options Animal. Having used other options training programs with limited success, going through the Options Animal courses has been like getting a graduate degree. Their courses are comprehensive yet understandable, and it’s particularly helpful to go into their video archives to take the same courses numerous times - each with a different instructor with a slightly different teaching approach. And it’s hard to beat theIr support and collateral materials.I highly recommend Options Animal.J. Michael Woollen
I am really happy I decided to subscribe to OptionsAnimal. Trading options is not easy, but OptionsAnimal provides you with all the information you need to trade options successfully. They cover all the different option trades, and, in the higher level lectures, they have algorithms which guide you through the management of trades after they are placed. I highly recommend OptionsAnimal.
Pretty good but only for novice.
My passion to trade has grew so big , Kathy have made my world beautiful for earning $6,570 on my little investment of $650 , I was always losing on options market .. Ever since I invest with Kathy Clarke, i was always on the good side. she never gamble with me but trade for me,,, all Thanks to Kathy Clarke for my wonderful earning..
I fully recommend Her to you to also share this great experience with me
Email:[email protected]
WhatsApp: +15182822295 These folks want to see you win. High quality options education.

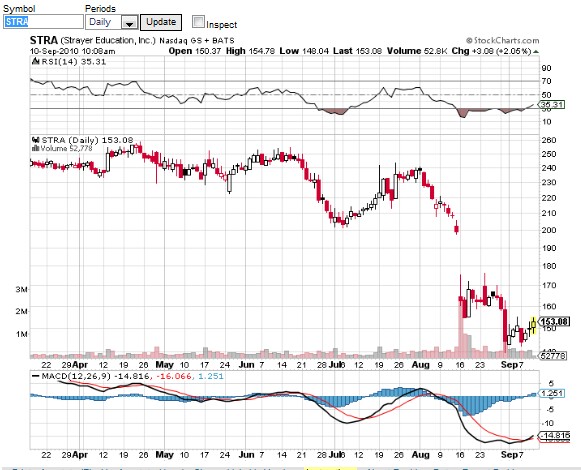 Moving Average Crossovers are trending indicators, while oscillators, in general, are momentum indicators. The MACD, a favorite here at OptionsAnimal, is a combination of some of the oscillator principles with those of a moving-average-crossover, a trending indicator.